|
P&P Market Report U.S.
Consumer Floral Purchasing for Proms &
Dances Rebounds from Recession Insight
from the 2014 Prince & Prince U.S.
Consumer Floral Tracking Survey Dr. Thomas L. Prince Dr. Timothy A. Prince Prince & Prince, Inc. Columbus, OH USA Release Date: April 18th, 2014
EXECUTIVE
SUMMARY This Prince & Prince (P&P) report profiles trends in consumer
floral purchasing for Proms & Dances, and represents the first
public release of market information from the 2014 Prince & Prince
U.S. Consumer Floral Tracking Survey, market research sponsored by
Smithers-Oasis N.A. (SONA).
About
16% of U.S. floral-buying households (an estimated 12.7 million households)
made at least one floral purchase for “Proms & Dances” in
2013, revealing a significant rebound of two percentage points from
the last P&P consumer survey conducted in 2010.
The rebound in floral purchasing for Proms & Dances was
largely pervasive across the U.S., with only the South Central region
showing losses for the category since 2010.
The Northeast and South Atlantic regions witnessed
statistically significant gains in floral purchasing for 2013 over
2010 levels. Several demographic groups drive consumer floral purchasing
for Proms & Dances, including household income, age of
householder, and presence of teenagers within the household.
Recent floral purchasing for the category is gravitating toward
higher income households (annual incomes greater than $50,000), a
trend that is more prominent since 2010.
Households with the highest incomes (over $100,000) now show
the highest likelihood to purchase floral for Proms & Dances
(21%). These recent
market trends suggest that the floral industry should likely focus on
more sophisticated, more affluent product offerings for the Proms
& Dances category.
Consumer floral purchasing for the category is largely
dominated by teenagers within the household, as nearly 40% of U.S.
floral-buying households with teenagers purchased floral product for
Proms & Dances in 2013, a sizeable rebound of six-percentage
points from 2010 levels. In
comparison, for households without teenagers, only 10% made a floral
purchase for Proms & Dances in 2013 (the adult dances side of the
category), but that level of purchasing was still somewhat higher than in 2010,
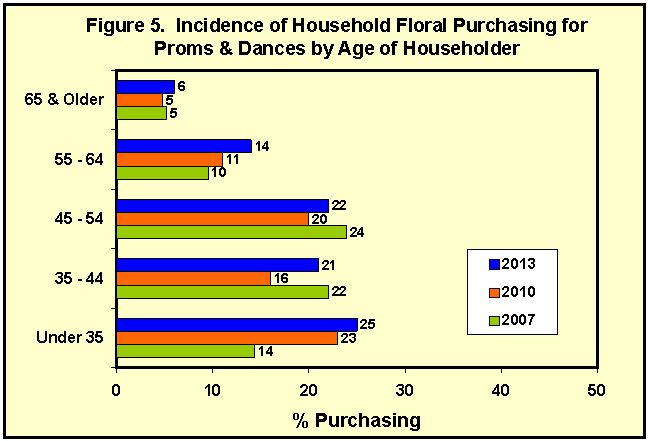
revealing the overall upward momentum for the category. Although consumer floral purchasing for Proms & Dances is inversely related to the age of householder (more mature purchase less), every consumer age group surveyed by P&P in 2013 witnessed a gain in floral purchasing for Proms & Dances over 2010 levels. These positive purchasing trends across all consumer age groups support the overall rebound in floral purchasing for Proms and Dances across much of the U.S. The floral industry should be fully prepared to exploit these positive consumer trends in floral purchasing for Proms & Dances, thereby expanding floral sales, and re-building the U.S. floral market.
U.S. Consumer Floral Purchasing for Proms & Dances Rebounds from Recession Insight from the 2014
Prince & Prince U.S. Consumer Floral Tracking Survey Drs. Tom & Tim Prince, Prince & Prince, Inc., Columbus, OH,
U.S.A. Special Note: This feature article is based on newly updated market research findings from the 2014 Prince & Prince (P&P) On-Site Seminar, “The U.S. Consumer Floral Tracking Survey, 2014 Edition”. The consumer floral purchasing metric for Proms & Dances is just one of over 100 purchasing metrics surveyed by P&P, and explored & analyzed in the updated P&P seminar, now available to members of the floral industry. For the 2014, 2010, and 2007 P&P consumer floral tracking surveys, the market research was sponsored by Smithers-Oasis, North America (SONA). P&P sincerely thank SONA for their continued support in making this consumer floral research possible, providing benefit for the entire floral industry. With
the recent completion of the 2014 Prince & Prince (P&P) U.S.
Consumer Floral Tracking Survey, and with full approval of P&P’s
key market research sponsor, Smithers-Oasis, North America (SONA),
P&P is again able to update the floral industry on salient
consumer floral-purchasing trends[1].
In this exclusive reporting, P&P present the first public
release of consumer floral market information from the updated P&P
tracking survey: a floral purchasing profile for Proms & Dances.
This reporting will show the overall household incidence of
floral purchasing for these occasions in 2013, as well as consumer
purchasing trends from 2010, 2007, and 2000.
In addition, P&P identify the key consumer segments driving
the floral purchasing trends for Proms & Dances. The
research findings in this reporting were excerpted from the updated
P&P consumer floral seminar (Prince & Prince, 2014), which
provides the floral industry valuable insight on consumer floral
purchasing trends, the holidays, events, and occasions of floral
purchasing, and the performance of the key floral channels that
represent the floral industry’s products to the end consumer (see
Table 1 for P&P seminar description).
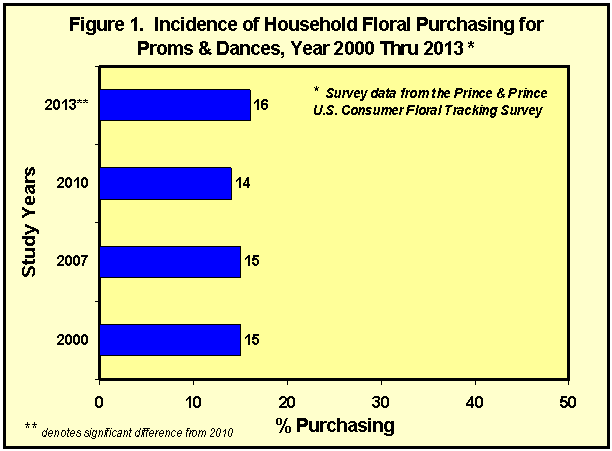
Since the 2014 Prom season has yet to commence at the time of this reporting, P&P will take a look at the 2013 P&P Prom & Dance survey results, and make comparisons with earlier P&P consumer floral survey results. Figure 1 shows that for 2013, about 16% of U.S. floral-buying households made at least one floral purchase for “Proms & Dances”, the highest percentage since P&P began tracking this consumer floral-usage category back in year 2000. P&P estimates that in 2013, about 12.7 million U.S. households made floral purchases for Proms & Dances, the highest in over a decade, and likely the highest number of households ever. P&P estimates that about 10.4 million households purchased floral for Proms & Dances in 2010, and a somewhat higher number in 2007 (11.8 million households), and about 11 million households way back in year 2000[2]. In fact, for 2013, consumer floral purchasing for Proms & Dances made a statistically significant rebound from the post-recession period of 2010,
when it registered 14%. While this reporting reveals that consumer floral purchasing gains have been made in this category, more details to be explored later in this reporting will show that there is plenty of market opportunity for the floral industry to make further gains in the Proms & Dances category, both on the “Prom” side, and on the “Dances” side of this category. To elucidate key consumer groups leading the Proms & Dances floral purchasing trends in the U.S., P&P segmented the overall survey findings by four key consumer demographic characteristics from the ten measured in the survey: 1) U.S. regions, 2) household income, 3) presence of teenagers in the household, and 4) age of householder. Incidence of
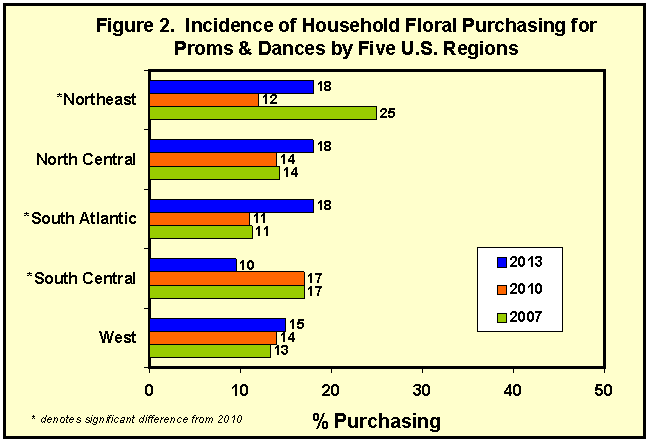
Purchasing Floral for Proms & Dances by Five U.S. Regions Figure 2 shows consumer household floral purchasing trends for Proms & Dances segmented by five major regions of the U.S. (see Appendix for region states). The regional purchasing profile in Figure 2 reveals that a consumer purchasing rebound for Proms & Dances was registered in four of the five U.S. regions for 2013. The Northeast and South Atlantic regions registered significant purchasing gains over 2010, while the South Central region witnessed significant losses for the category. The West region has made small, but steady
gains in the Proms & Dances category since 2007. The North Central region (Midwest) also rebounded in 2013 from 2010 purchasing levels, but the four-point gain in the North Central region was not statistically significant at the 90% confidence level (but it was significant at the 75% confidence level). This U.S. regional profile, showing purchasing gains in 4 out of 5 major regions, exemplifies the broad rebound in consumer floral purchasing for Proms & Dances in 2013, compared to earlier years. However, the floral industry is quite far from “topping out” on this floral occasion as the current regional purchasing levels (maximum of 18% purchasing incidence) are far from the 25% level obtained in the Northeast region back in 2007 (prior to the U.S. recession). Incidence of
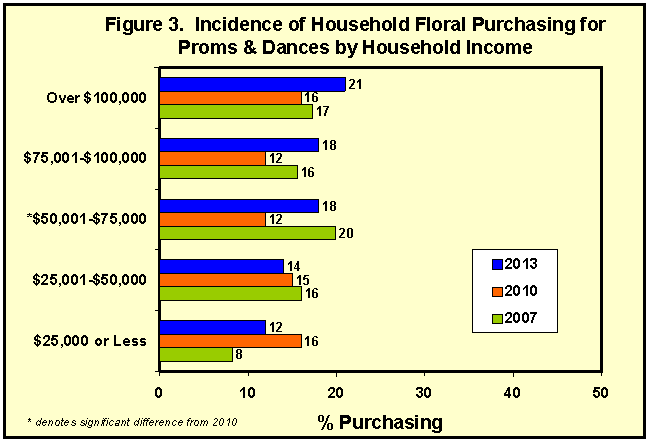
Purchasing Floral for Proms & Dances by Household Income Figure 3 shows consumer household floral purchasing trends for Proms & Dances segmented by annual household income. For 2013, consumer floral-purchasing for Proms & Dances generally increases with increasing household income. And those in the highest income category show the highest likelihood to purchase floral for Proms & Dances (21%). In prior survey years, consumer floral purchasing for Proms & Dances showed little relationship with consumer household income. Comparing 2013 with 2010, gains in floral purchasing for Proms & Dances were registered for those households with annual incomes greater than $50,000, with a statistically significant six-percentage point gain for those with annual
incomes between $50,001 and $75,000. Floral purchasing for Proms & Dances retreated somewhat for those earning $50,000 or less. These recent purchasing trends across the “income ladder” suggest that the floral industry should likely focus on more sophisticated, more affluent floral offerings for Proms & Dances, as the purchasing gains are largely tied to higher income consumer groups. Teenagers
in the Household Set the Floral Purchasing Trends for Proms &
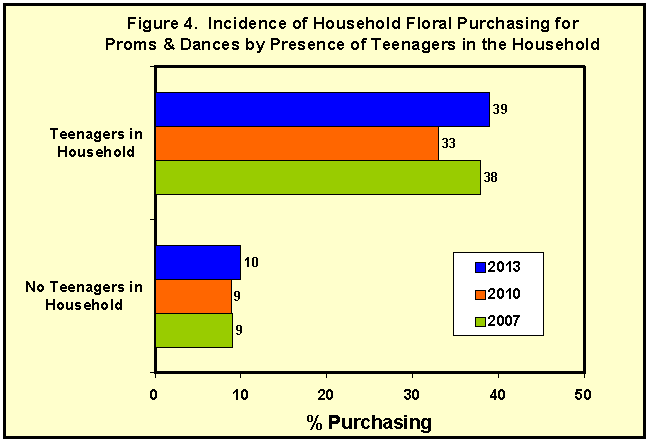
Dances Consumer floral purchasing trends for Proms & Dances segmented by presence of teenagers within the household are shown in Figure 4. The purchasing trends shown in Figure 4 reveal that the overall category of “Proms & Dances” is largely dominated by household floral purchasing by or for teenagers. In 2013, 39% of floral-buying households with teenagers purchased floral product for Proms & Dances, a rebound of six-percentage points from 2010 levels, and one-percentage point higher than the previous high of 38% set prior to the U.S. recession (2007). This purchasing trend exemplifies the recent strength of the Proms &
Dances rebound, with consumer purchasing surpassing pre-recession levels. In comparison, for households without teenagers, only 10% made a floral purchase for Proms & Dances in 2013, but that level was still slightly higher than in prior survey years (9% in 2010 and in 2007), suggesting that there is likely some recent “upward movement” for the category beyond the teenager market (the Dances by Adults side of the category). Incidence
of Purchasing Floral for Proms & Dances by Age of Householder Figure 5 shows consumer household floral purchasing trends for Proms & Dances segmented by age of householder. Although floral purchasing for the category generally declines with increasing age of householder, for 2013, every consumer age group surveyed by P&P witnessed a gain in floral purchasing for Proms & Dances over 2010 levels. These segmented purchasing trends by consumer age group also support the broad re-bound in U.S.
consumer floral purchasing for Proms & Dances for 2013, e.g. the trend “has legs” into every consumer age group, including “young households” (under age 35) and the “mature market” (age 55 and older). For young households in 2013, floral purchasing for the Proms & Dances category was the highest (25%), likely reflecting floral purchasing for Adult Dances, as well as Teenage Dances, and some proms (15% of floral-buying households under the age of 35 had teenagers within the household; data table not shown). The steady category purchasing gains among the mature market, especially those aged 55 to 64, likely reflect floral purchases for adult dances. However, some of the category purchasing gains for this mature age group could be attributed to proms and teenage dances as well, as 16% of floral-buying households aged 55 to 64 had teenagers residing within the household. Overall, the household age purchasing profile for Proms & Dances is quite positive, again reflecting the strength of the recent re-bound in floral purchasing for this category. Literature Cited Prince, T.L., and Prince, T.A. (2013). Consumer Demographic Trends Lift Floral Purchasing for Easter. (Report on the P&P web site, under Features) Columbus, OH: Prince & Prince, Inc. Prince, T.L., and Prince, T.A. (2014). The Prince & Prince U.S. Consumer Floral Tracking Survey. (On-Site Seminar) Columbus, OH: Prince & Prince, Inc. About
the P&P Consumer Floral Seminar.
The
market information in this article was obtained from the updated
Prince & Prince (P&P) Consumer Floral Seminar, “The
U.S. Consumer Floral Tracking Survey, 2014 Edition”, which P&P now offers to members of the floral industry and allied
trade. Smithers-Oasis
North America (SONA) was the key sponsor for the 2014 P&P consumer
research, and SONA requests attendance at P&P seminars presented
in 2014 (schedules permitting).
The one-day (or half-day) on-site seminar covers consumer
floral purchasing trends on over 100 metrics prior to the U.S.
recession (2007), after the recession (2010), and into the recovery
period (2013). The
seminar reveals numerous “stories” about emerging U.S.
floral-market trends, floral-product purchasing trends, consumer
priorities in floral purchasing, the changing floral channels of
distribution, consumer satisfaction and dissatisfaction with floral
purchases made at the various channels, and the opportunities and
challenges that are currently unfolding for the U.S. floral industry.
Please contact P&P for on-site seminar fees and scheduling.
Methods & Definitions Used by Prince & Prince. In the P&P consumer surveys, P&P measures the household incidence of floral purchasing for 24 holidays, occasions, and events, including those floral purchases made specifically for Proms & Dances. P&P defines floral purchasing as the purchasing of fresh cut flowers (arrangements, bouquets, roses, bunches, “stems-to-arrange” (do-it-yourself), and corsages) and/or indoor fresh potted plants (flowering plants, foliage plants, and dish gardens/planters), not outdoor bedding/garden plants. By household purchasing incidence, P&P means the purchase of one or more floral products by the household for Proms & Dances during the study year. P&P shows the purchasing incidence as the percentage of floral-buying households that made a floral purchase for Proms & Dances for the specific survey years. The P&P survey also collects ten consumer demographic measures that are used in segmentation analyses, including consumer age, income, education, urbanization, U.S. region, household composition, and annual level of household floral spending. In this report, P&P highlights historical household floral purchasing trends for Proms & Dances, and shows these purchasing trends across several demographic segments. An asterisk ( * ) next to a particular demographic category (e.g. income of $25,000 or less) denotes a significant trend between 2013 and 2010 for that demographic category. P&P uses pre-planned, single-degree-of-freedom orthogonal contrasts in their ANOVA designs to test the significance between 2013 and 2010 for a particular demographic category. Definition of U.S. Census Regions. The five Census regions are identified by the following states: Northeast (CT, MA, ME, NH, NJ, NY, PA, RI, VT), North Central or Mid-West (IA, IL, IN, KS, MI, MO, MN, NE, ND, OH, SD, WI), South Atlantic (DC, DE, FL, GA, MD, NC, SC, VA, WV), South Central (AL, AR, KY, LA, MS, OK, TN, TX), and West (AK, AZ, CA, CO, HI, ID, MT, NM, NV, OR, UT, WA, WY). About the Authors. Drs. Tom and Tim Prince, formerly of The Ohio State University, are brothers and co-founders of Prince & Prince, Inc. (P&P), a leading marketing research specialist in the floral and green plant industries. P&P has completed more than 50 major marketing research projects and countless reports for the floral and floral-related industries in the U.S., and has also conducted floral marketing research in Canada, the United Kingdom, Holland, Germany, and Spain. P&P conceptualize, design, and implement market research projects and product tests for floral and green-plant suppliers, hardgood suppliers, floral importers, wholesale florists, retail florists, floral-industry associations, and companies serving the allied floral trade. For more information about P&P marketing research and services, and their informative on-site seminars, visit their web site at www.FloralMarketResearch.com , or contact Prince & Prince below.
[1] P&P’s prior consumer report was from the 2010 P&P consumer floral survey, and the topic was consumer floral purchasing for the Easter holiday (Prince & Prince, 2013). [2] Purchasing estimates based on number of U.S. households in survey year, estimated household participation rate in the floral market in survey year, and incidence of household floral purchasing for Proms & Dances in survey year.
Prince & Prince, Inc. PO Box 2465, Columbus, OH 43216-2465 Mobile: 614-264-0939 Email: 2640939@gmail.com
|
