The Influence of a “Weekend” Valentine’s Day Holiday
on Consumer Floral Purchasing Insight from the Prince & Prince U.S. Consumer Floral
Tracking Survey Thomas L. Prince, Ph.D. Timothy A. Prince, Ph.D. Prince & Prince, Inc. Columbus, OH USA FloralMktResearch@att.net
614-299-4050 Report Date: January 19th, 2016
EXECUTIVE SUMMARY Valentine’s
Day 2016 falls on a weekend, Sunday February 14th.
Many in the U.S. floral industry believe that a weekend
Valentine’s Day results in dampened floral sales.
Prince & Prince (P&P) test this “theory” with
historical U.S. consumer floral purchasing data for Valentine’s Day from
P&P surveys conducted in 1996, 2000, 2007, 2010, and 2013.
P&P compare household Valentine’s Day floral purchasing
(incidence of floral purchase) when the holiday fell on weekdays (1996,
2000, 2007, 2013), and when the holiday fell on a weekend (2010). The
P&P survey data suggests a slight increase
in consumer floral purchasing for Valentine’s Day when the holiday falls
on the weekend, compared to weekday holidays. Of all floral-buying households that purchase for
Valentine’s Day (around 49% in 2013), about two percent more households
purchase for a weekend holiday, which translates into an estimated $130
million in additional floral spending for Valentine’s Day.
Thus, the P&P consumer research findings refute the floral
industry’s “common knowledge” related to less floral purchasing for
a weekend Valentine’s Day. The increase in weekend Valentine’s Day floral purchasing is largely driven at both ends of the household income ladder, among more mature floral-buyer segments (age 55 and older), and among single-male households. While younger-aged households (under age 35) still show strong likelihood to purchase floral products for Valentine’s Day, a weekend holiday (as in 2016) likely offers more opportunities to target additional consumer groups to expand the market for this all-important floral holiday.
The Influence of a “Weekend” Valentine’s Day Holiday on
Consumer Floral Purchasing Insight from The Prince
& Prince U.S. Consumer Floral Tracking Survey Special Note: This consumer floral research was sponsored by Smithers-Oasis North America (SONA). P&P sincerely thank SONA for their financial support in making this survey research possible, providing benefit for the entire floral industry. The 2014 U.S. Consumer Floral Tracking Survey is now available from P&P with an on-site seminar format, including Q&A session, as well as a “Seminar on Flash”. Valentine’s
Day 2016 falls on the weekend, Sunday, Feb. 14th, and aggregate
U.S. consumer floral spending for this holiday has a projected retail
value of $3.3 billion (Prince & Prince, 2016), ranking second behind
the Mother’s Day holiday (Prince & Prince, 2015).
However, members of the U.S. floral industry have often viewed a
“weekend” Valentine’s Day with some trepidation, thinking that the
weekend holiday would likely result in dampened consumer floral sales.
Prince & Prince, Inc. (P&P), a leader in market research
focused on the floral and green plant industries, has been tracking U.S.
consumer household floral purchasing for Valentine’s Day (as well as 20+
other holidays, events, & occasions) for nearly 20 years with their
periodic surveys nationwide (surveys in 1996, 2000, 2007, 2010, and 2013;
Prince & Prince, 2014a). Thus,
P&P is able to provide insight on consumer floral purchasing trends
over time for specific holidays, events, and occasions, including
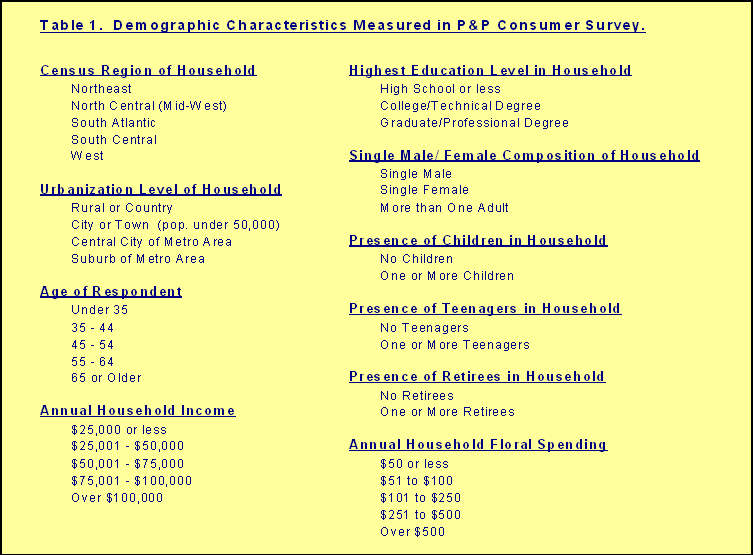
Valentine’s Day. Interestingly, P&P’s 2010 survey captured consumer floral purchasing for Valentine’s Day on the weekend, as Valentine’s Day fell on Sunday in 2010. Thus, P&P is able to make historical comparisons of consumer floral purchasing for Valentine’s Day when the holiday falls on a weekend (2010), and when it falls on weekdays (other survey years), and provide insight on the influence of the upcoming 2016 weekend Valentine’s Day on consumer floral sales (up, down, or no change) compared to weekday holidays. In addition, since the P&P survey tracks floral purchasing at the individual household level, P&P is able to ascertain the specific household demographic segments where the weekend floral purchasing effect is most pronounced, enabling development of marketing and business strategies targeted to specific consumer segments to bolster weekend Valentine’s Day floral sales. Table 1 shows the household demographics measured in the P&P consumer floral survey.
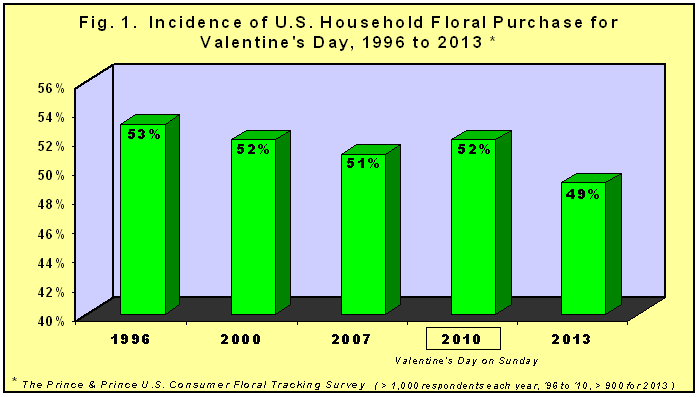
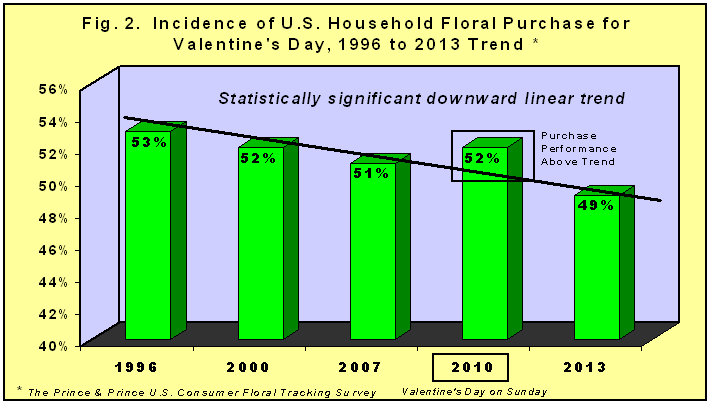
Figure 1 shows the historical U.S. household incidence[1] of purchasing floral product[2] for Valentine’s Day across the past five P&P consumer surveys. For 2013, 49 percent of floral-buying households [3] in the U.S. purchased floral products for Valentine’s Day (Thursday of the week), down three percentage points since Valentine’s Day of 2010 (Sunday of the week), and the lowest purchasing incidence since P&P’s initial consumer floral survey in 1996 (53%; Wed. of the week). In fact, the household floral-purchasing trend across the five survey periods
suggests a slight downward linear trend, as depicted in Figure 2. P&P conducted statistical trend analysis [4] on the Valentine’s Day purchasing data across the five survey years, and P&P is 75% confident [5] that the linear downward trend is real, and not due to chance. P&P has previously discussed this historical downward trend in Valentine’s Day purchasing and its implications for the industry (Prince & Prince, 2014b). P&P’s interest in this reporting is the trend associated with the 2010 survey data, when Valentine’ Day fell on a weekend.
The 2010 purchasing data suggests an increase in consumer floral purchasing for Valentine’s Day (about two percentage points higher) when the holiday falls on the weekend, that is, floral purchasing above projected historical trend (largely when the holiday fell on weekdays). This higher floral purchasing trend for a weekend Valentine’s Day largely goes counter to conventional wisdom in the floral industry. And while this increase in purchasing is considered small in terms of the percentage of floral-buying households, in terms of aggregate spending, a weekend Valentine’s Day likely translates into an estimated $130 million in additional floral spending nationwide. While P&P cannot state with assurance that the relationship between increased consumer floral purchasing and the weekend holiday is causal, due to the limitations of the P&P survey research [6], an association is duly noted, and future tracking research is likely required to verify this finding [7]. To better understand the demand structure of this heightened Valentine’s Day floral purchasing on the weekend, P&P segmented the historical purchasing data for Valentine’s Day by the demographic characteristics of the household, and profiled the key demos that drive higher weekend floral purchasing for this holiday. Results of that segmentation analysis follow. Low
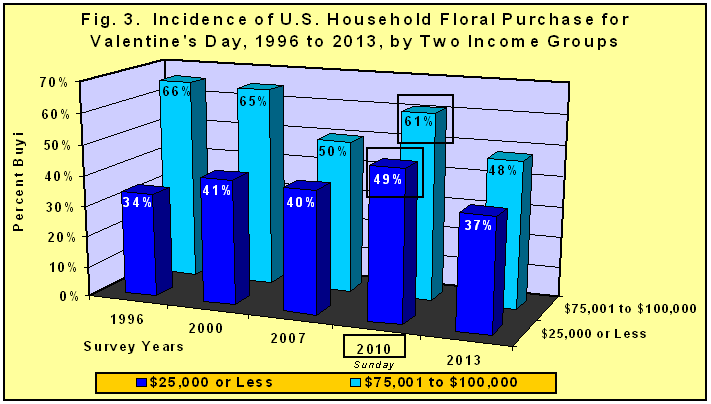
Income and High Income Households Influence Weekend Purchasing Households with annual income of $25,000 or less, and those households with annual income of $75,001 to $100,000 showed heightened floral purchasing for the weekend Valentine’s Day in 2010, compared to other survey years when the holiday fell on weekdays (Figure 3). The magnitude of this increase in weekend floral purchasing for these two consumer income groups is quite substantial, estimated at about a ten percentage point increase for each group attributed to the weekend Valentine’s Day. Thus, a weekend Valentine’s Day expanded consumer floral
purchasing
at both ends of the income ladder.
Another trend worth noting in Figure 3 is the healthy level of
Valentine’s Day floral purchasing among the higher income consumer
group during the latter “Clinton Boom Years” of 1996 thru 2000,
perhaps a possible target going forward. “Mature
Households” Influence Weekend Purchasing While
the youngest households (age under 35) show the highest incidence of
floral purchase for Valentine’s Day across all survey years, it is the
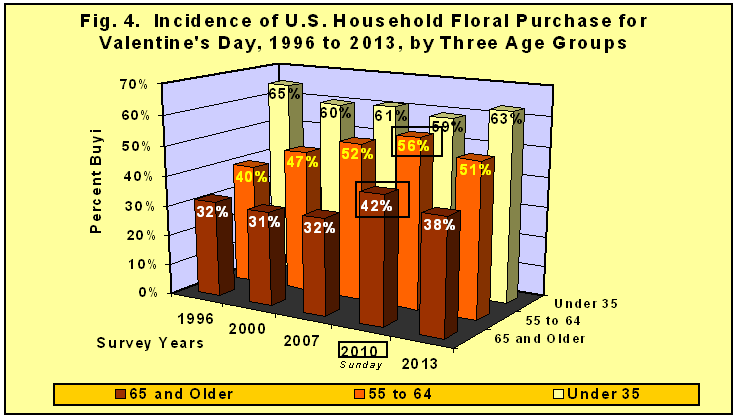
more mature consumer segments (age 55 to 64, and age 65 and older) that
show heightened floral purchasing for Valentine’s Day 2010, when the
holiday fell on the weekend (Figure 4). However, the purchasing gain attributed to a weekend
Valentines Day for these two age groups is modest (around five
percentage points each).
For the two eldest household segments, the general “building
trend” in Valentine’s Day floral purchasing across the survey years,
initially in 2000 with the 55 to 64 age group, and then later in 2013
with the 65 and older age group, is likely influenced by the “baby
boomer generation” [8] moving
thru the survey periods, a traditionally strong group of floral
purchasers.
Single
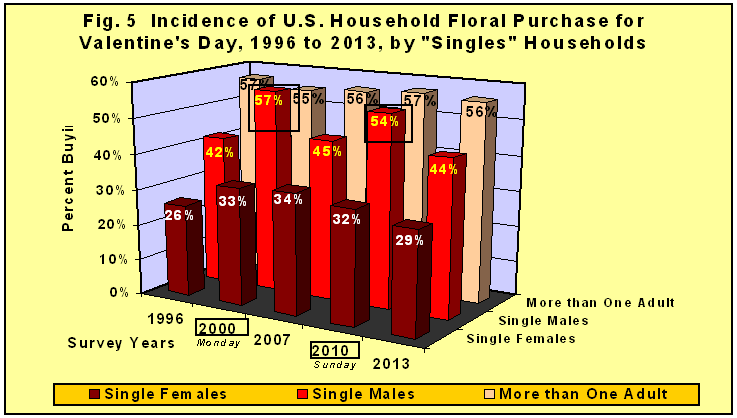
Male Households Influence Weekend Purchasing Figure
5 shows the profile of Valentine’s Day floral purchasing across the
survey years for households composed of a single female, a single male,
and households with more than one adult living in the household.
Single male households drove floral purchasing substantially
higher for the weekend Valentine’s Day in 2010 (about ten percentage
points higher), compared to most survey years with weekday holidays.
An exception to this was in 2000, when the Valentine’s Day
holiday fell on Monday, in which single males also exhibited heightened
floral purchasing, the only consumer group to do so.
This market finding either challenges the weekend Valentine’s
Day effect, or it extends the “theory” to include the following
Monday as well. The
year 2000 heightened floral purchasing for single males could be
attributed to more impulse purchasing by singles males on the weekend,
prior to the Monday holiday, rather than pre-planned floral purchases
for Valentine’s Day. Or
the heightened Monday purchasing could simply be due to the single
male’s girlfriend (or boyfriend) having the entire weekend to remind
him that Valentine’s Day is just around the corner!
Concluding Remarks The
floral market findings profiled in this P&P report again remind
members of the floral industry to remain vigilant and continually focus
on the market, and seek to understand the market opportunities that are
unfolding for the floral industry.
The consumer floral market evolves over time, and our marketing
and business strategies need to adapt to best exploit these new market
opportunities. While
not specifically addressed in this report, the dynamics exhibited in the
key retail floral channels over the past ten years or so (detailed in
the P&P seminar), likely has influence on the current weekend
Valentine’s Day effect, possibly enhancing consumer weekend holiday
floral purchasing. Future
P&P tracking research will verify and quantify these important
floral market dynamics, and in turn, assist members of the floral
industry in gaining a better understanding of consumer floral purchasing
behavior for market advantage. 2017
P&P Consumer Floral Research Update Prince
& Prince is currently seeking research co-sponsors for a 2017 update
of the P&P U.S. Consumer Floral Tracking Survey
(see specific survey content at the P&P web site).
The survey tracks the type of consumer who purchases fresh floral
product, and identifies what they buy, where they buy, when they buy,
why they buy, and how much they spend. The research also provides a comprehensive consumer
evaluation of the floral channels where consumers purchase (each
household rates up to three floral businesses where they purchase on
more than 30 attributes). Research
co-sponsors receive the floral market information first thru a one-day,
on-site seminar with Q&A, the complete 800+ slide presentation on
flash drive for future reference, and sponsors receive exclusivity of
the market information for a one-year period.
Interested parties should contact P&P for research
sponsorship opportunities. Literature
Cited Prince,
T.L. and Prince, T.A. (2016). Prince
& Prince Project a $3.3 Billion Dollar U.S.
Consumer Floral Market for Valentine’s Day
2016. Columbus,
OH: Prince & Prince, Inc. (Press Release, Under “News” at
P&P Web Site). Prince,
T.L. and Prince, T.A. (2015). Prince
& Prince Project the U.S. Consumer Floral Market
for Mother’s Day 2015 at $3.9
Billion Dollars.
Columbus, OH: Prince & Prince, Inc. (Press Release, Under
“News” at P&P Web Site). Prince,
T.L. and Prince, T.A. (2014a). The
Prince & Prince U.S. Consumer Floral Tracking Survey, 2014 Edition.
Columbus,
OH: Prince & Prince, Inc. (On-Site Seminar and “Seminar on
Flash”). Prince, T.L. and Prince, T.A. (2014b). Historical Downward Trend in Consumer Floral Purchasing for Valentine’s Day: A “Wake-Up” Call for the Industry? Columbus, OH: Prince & Prince, Inc. (Market Report at P&P Web Site: www.FloralMarketResearch.com). Recent P&P Report Releases (At the P&P web site) 3)
U.S. Consumer Floral Purchasing for Proms & Dances Rebounds from
Recession.
About
the Authors Drs. Tom and Tim Prince, formerly of The Ohio State University, are brothers and co-founders of Prince & Prince, Inc. (P&P), a leading marketing research specialist in the floral and green plant industries. P&P has completed more than 75 major marketing research projects and countless reports for the floral industry in the U.S., and has also conducted market research in Canada, the UK, Holland, Germany, and Spain. P&P conceptualize, design, and implement market research projects for floral and green-plant suppliers, hardgood suppliers, floral importers, wholesale florists, retail florists, floral-industry associations, and companies serving the allied floral trade. For more information about P&P marketing research and services, please contact Prince & Prince.
[1] By “incidence”, P&P means the percentage of U.S. floral-buying households that purchase of one or more floral products specifically for Valentine’s Day. [2] P&P define “floral product” as fresh cut flowers (floral arrangements, bouquets, bunches, single stems, and corsages) and indoor potted flowering plants, and foliage plants/ planters, NOT outdoor bedding/ garden plants, vegetables, or perennials/ landscape plants. [3] The P&P consumer floral tracking survey is a national survey of floral-buying households. P&P define a floral-buying household as a household that purchases at least one floral product throughout the year, no matter how large or small the dollar purchase. This household is deemed to participate in the U.S. floral market. Since purchasing floral is a discretionary product purchase, one needs to understand the U.S. household participation rate when calculating national floral market statistics. [4] P&P used pre-planned,
single degree-of-freedom orthogonal contrasts (Multivariate Analysis of
Variance, MANOVA program in SPSS Advanced Models; Anon. 1999) in
determining the nature of the trend (e.g. linear, quadratic, etc.) and
the statistical significance of the trend. [5] P&P’s confidence level of the linear downward trend would have exceeded 90%, if the 2010 survey data (purchasing over-performance) had been removed from the historical statistical analysis. [6] The P&P U.S. Consumer
Floral Tracking Survey is categorized as cross-sectional survey
research conducted over multiple time periods, not a “controlled
market experiment” with control markets and treatment markets where
causality may be assumed. Notwithstanding,
P&P believes the consumer survey, conducted over multiple years,
with and without a weekend Valentine’s Day, and with comparative
trend analysis, provides strong evidence of the impact of the weekend
holiday on consumer floral purchasing. [7] P&P plans to update the consumer floral tracking research in 2017, covering the entire 2016 consumer floral purchasing season, including Valentine’s Day, if sufficient research funding can be secured. See the end of this report for “P&P research co-sponsorship opportunities” in supporting and sharing this research. [8] The first wave of “baby boomers” turned 65 in January of 2011. This generation stretches about 19 years, and comprises nearly 80 million people, or more than one-quarter of the total U.S. population.
|
|
|
Prince & Prince, Inc. PO Box 2465, Columbus, OH 43216-2465 Mobile: 614-264-0939 Email: 2640939@gmail.com
|
